Introduction
Today, identifying subsurface discontinuities such as cavities and fractures in roads and passages is considered one of the important challenges (Bendetto et al., 2017). These discontinuities can reduce the resistance of road structures, cause collapses, create dangerous subsidence and surface depressions that give the roadway an unsightly appearance and generate high costs for roadway repairs. One of the issues that challenges the construction and maintenance of this type of infrastructure is the lack of sufficient knowledge of the subsurface layers, which sometimes causes extensive damage during construction or operation. Conventional methods for identifying subsurface discontinuities are often destructive and based on drilling and sampling, which, despite their high reliability, are costly and time-consuming. Therefore, geophysical methods can be used for road studies due to being cost-effective and time-efficient (Hosaini et al., 2017). Among these geophysical methods, ground-penetrating radar (GPR) is of great importance due to its high accuracy and speed, and non-destructiveness. It is considered one of the electromagnetic methods (Slob et al., 2010). The use of high-frequency electromagnetic waves for subsurface exploration dates back to 1904 when Hulsmeyer, a German inventor, invented a radar device (Parasnis, 1997). The use of radar became popular in 1956 and was developed more widely from 1970 onwards. GPR is able to detect changes in the electrical properties of materials. However, the selection of the appropriate antenna frequency is considered to be one of the key parameters in the success of this method (Daniels, 2004).
Although several studies have investigated the effectiveness of GPR in identifying subsurface discontinuities, systematic comparison of the capabilities of antennas with different frequencies (especially 170 and 600 MHz) in environments with different soil types, as well as targeted processing and wavefront spectrum analysis for optimal interpretation to distinguish between types of discontinuities, requires further research. Therefore, this study aims to investigate the capability of GPR with 170- and 600-MHz antennas in detecting subsurface cavities and fractures.
Materials and Methods
Ground penetrating radar
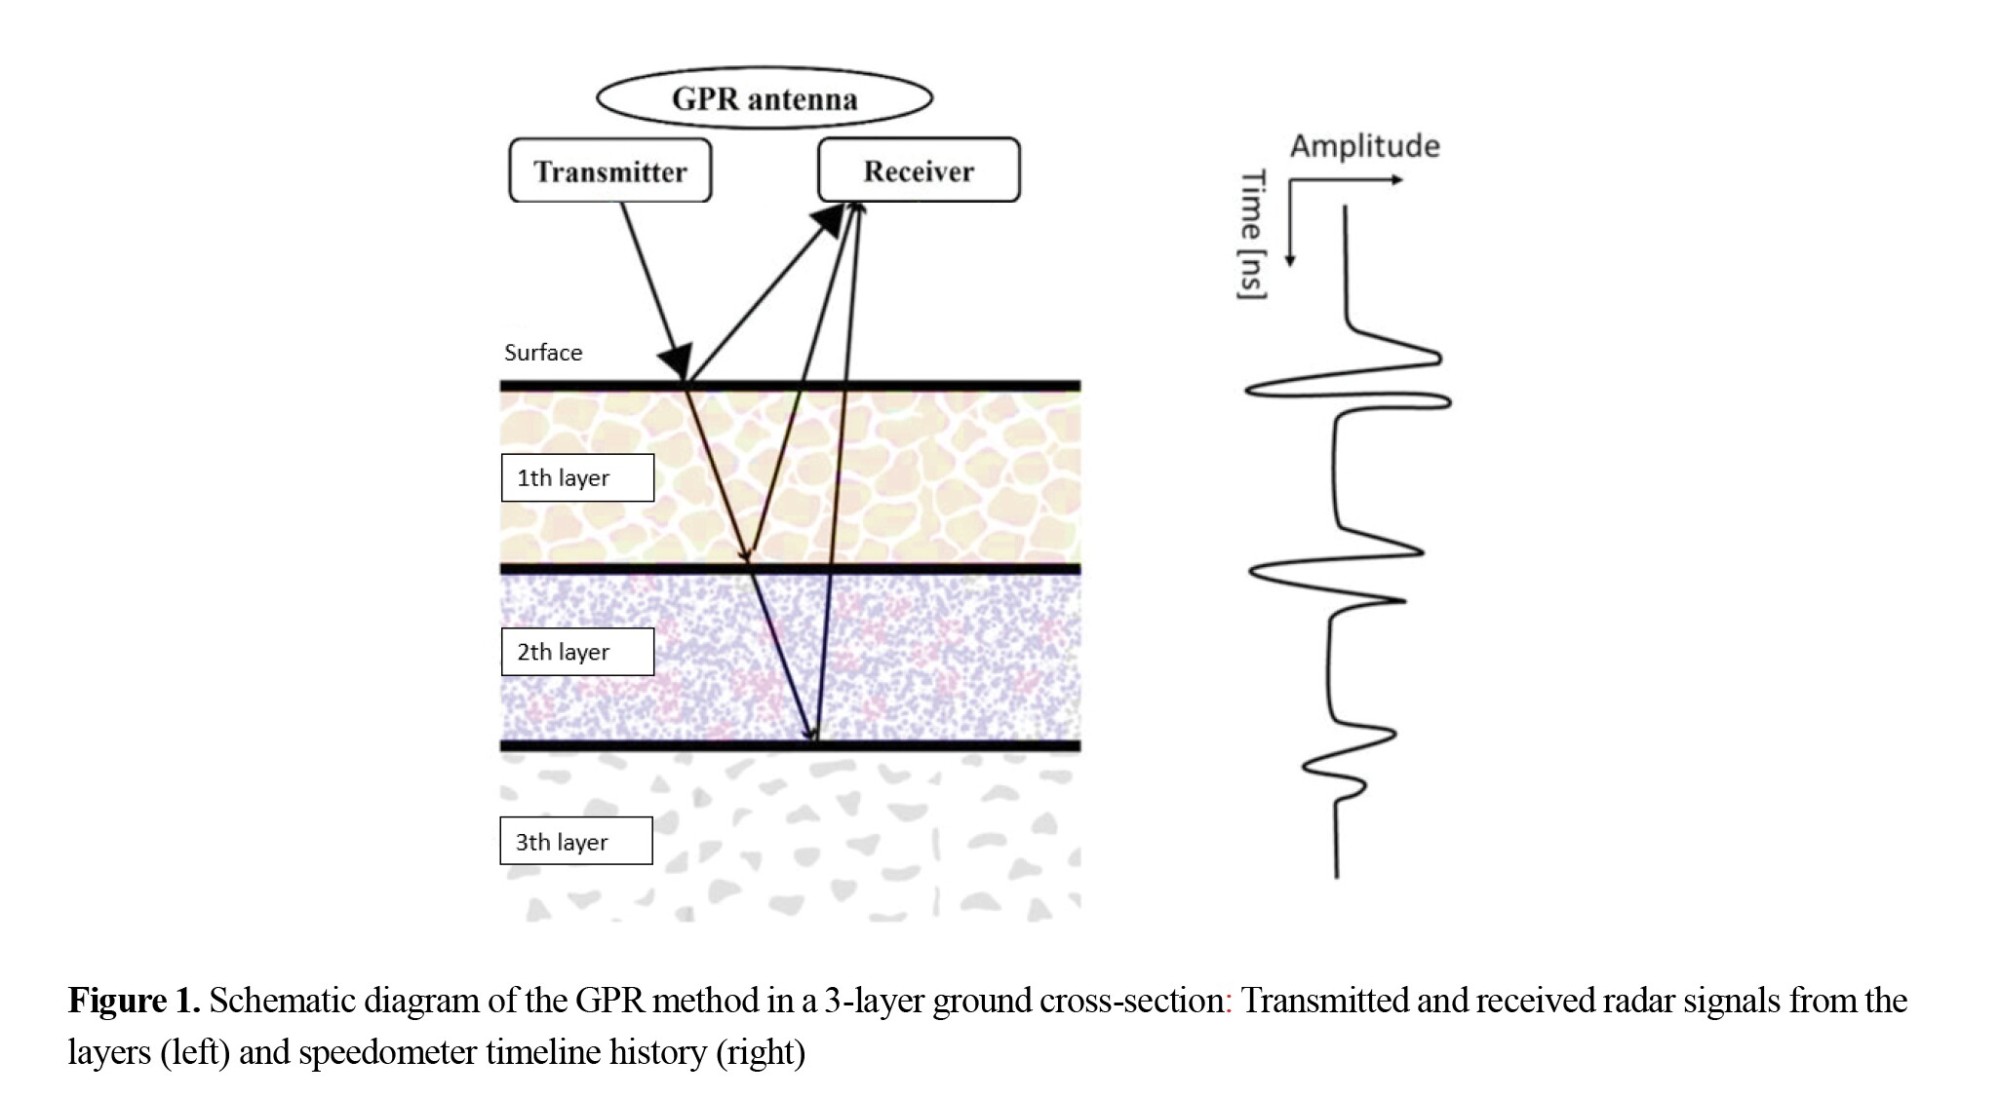
The GPR method is the most widely used geophysical shallow technique that requires high-resolution accuracy (Annán, 2009). The basis of this method is the reflection of electromagnetic waves at the boundary of layers with different resistivity and magnetization. In this method, the radio waves are generated by special transmitters (antennas) and, after penetrating into the ground and reflecting from the boundary of the layers, are recorded by inductive receivers. Since the transmitter and receivers are mounted side by side on a portable setup, the data acquisition speed in this method is very high. The accuracy of this method ranges from a few centimeters to several meters, depending on the frequency of the antenna used. Ground-based radar operates by transmitting electromagnetic waves (10-1000 MHz) into the ground and receiving reflected pulses when encountering discontinuities (Ahmadi et al., 2014). The discontinuity can be a boundary between layers, an impurity, boundary between materials with different dielectric properties, a buried object (e.g. pipe) or delamination of that cross section (Figure 1). The amplitude of the received echoes and their corresponding arrival times can be used for subsurface modeling to determine the nature and location of the discontinuity.
Compared to other non-destructive techniques such as infrared, ultrasonic, or microwave thermography, GPR offers greater penetration power and can therefore model at greater depths. High-frequency antennas (800 MHz and above) are used in shallow areas (<2 m depth) to achieve high accuracy, while lower-frequency antennas (300, 250, 100, and 50 MHz) are used for deeper depths.
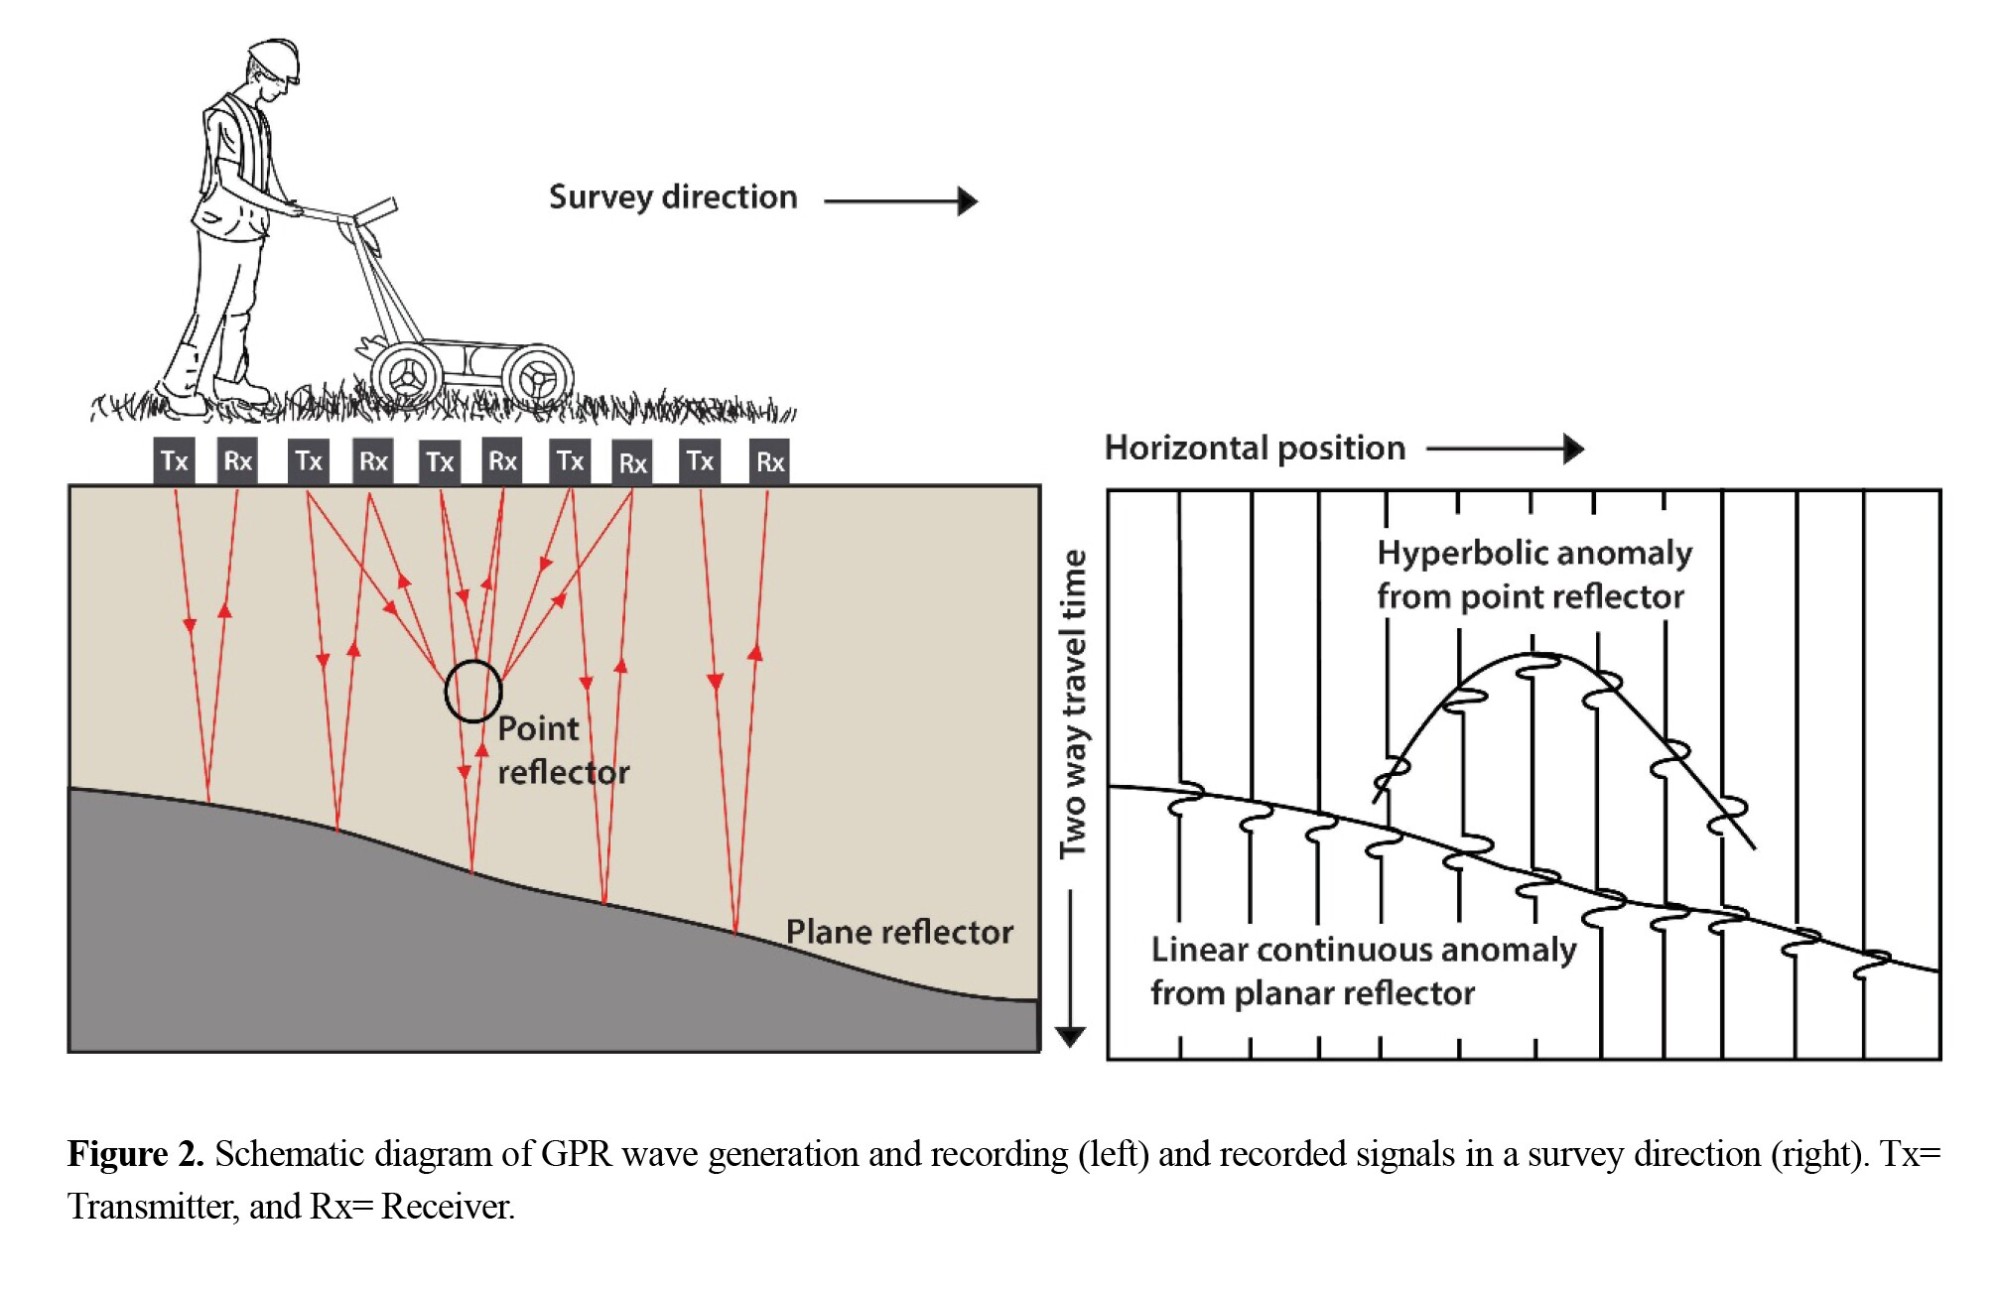
GPR is a real-time method that uses high-frequency radio waves to acquire data at very high velocity and resolution (Neal, 2004). Changes in the velocity of wave propagation due to differences in the electrical properties of materials will result in differences in the time it takes for the waves to travel and return. As the antennas move along the survey line, they collect a time series of received data at specific points along the line. These time series are then combined to create a subsurface scan view. Figure 2 shows a schematic diagram of the GPR wave propagation and recording. The data is recorded in specific formats. After going through various processing steps, this information is transformed into georadar sections that are used to identify various targets.
 Data collection and study area
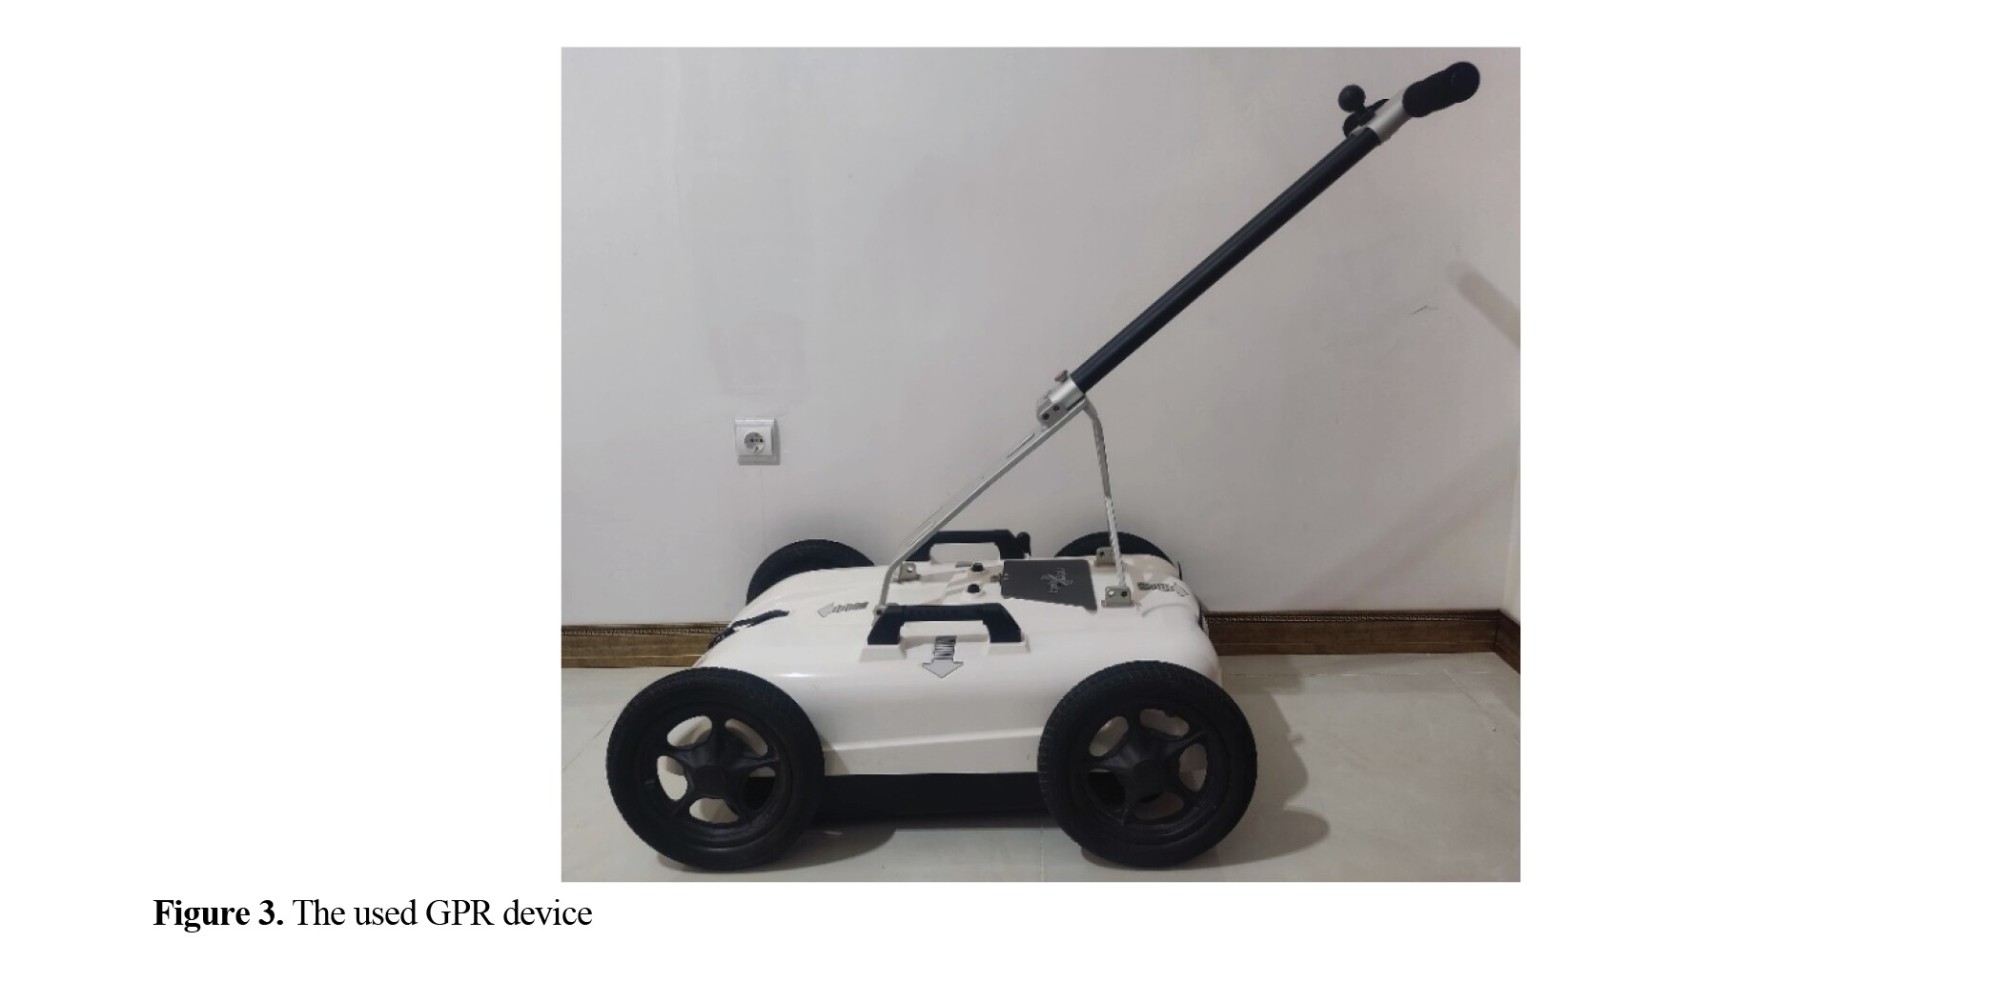
In this study, data were collected in designated sections within the target areas using a radar (model 1760, ImpulseRadar Co., Sweden), shown in Figure 3. This model has two antennas with frequencies of 170 and 600 MHz. The data collected with this tool, with high resolution, allows us to identify layers, cavities, and fractures near the surface (<12 meters) (Goodman & Piro, 2013).
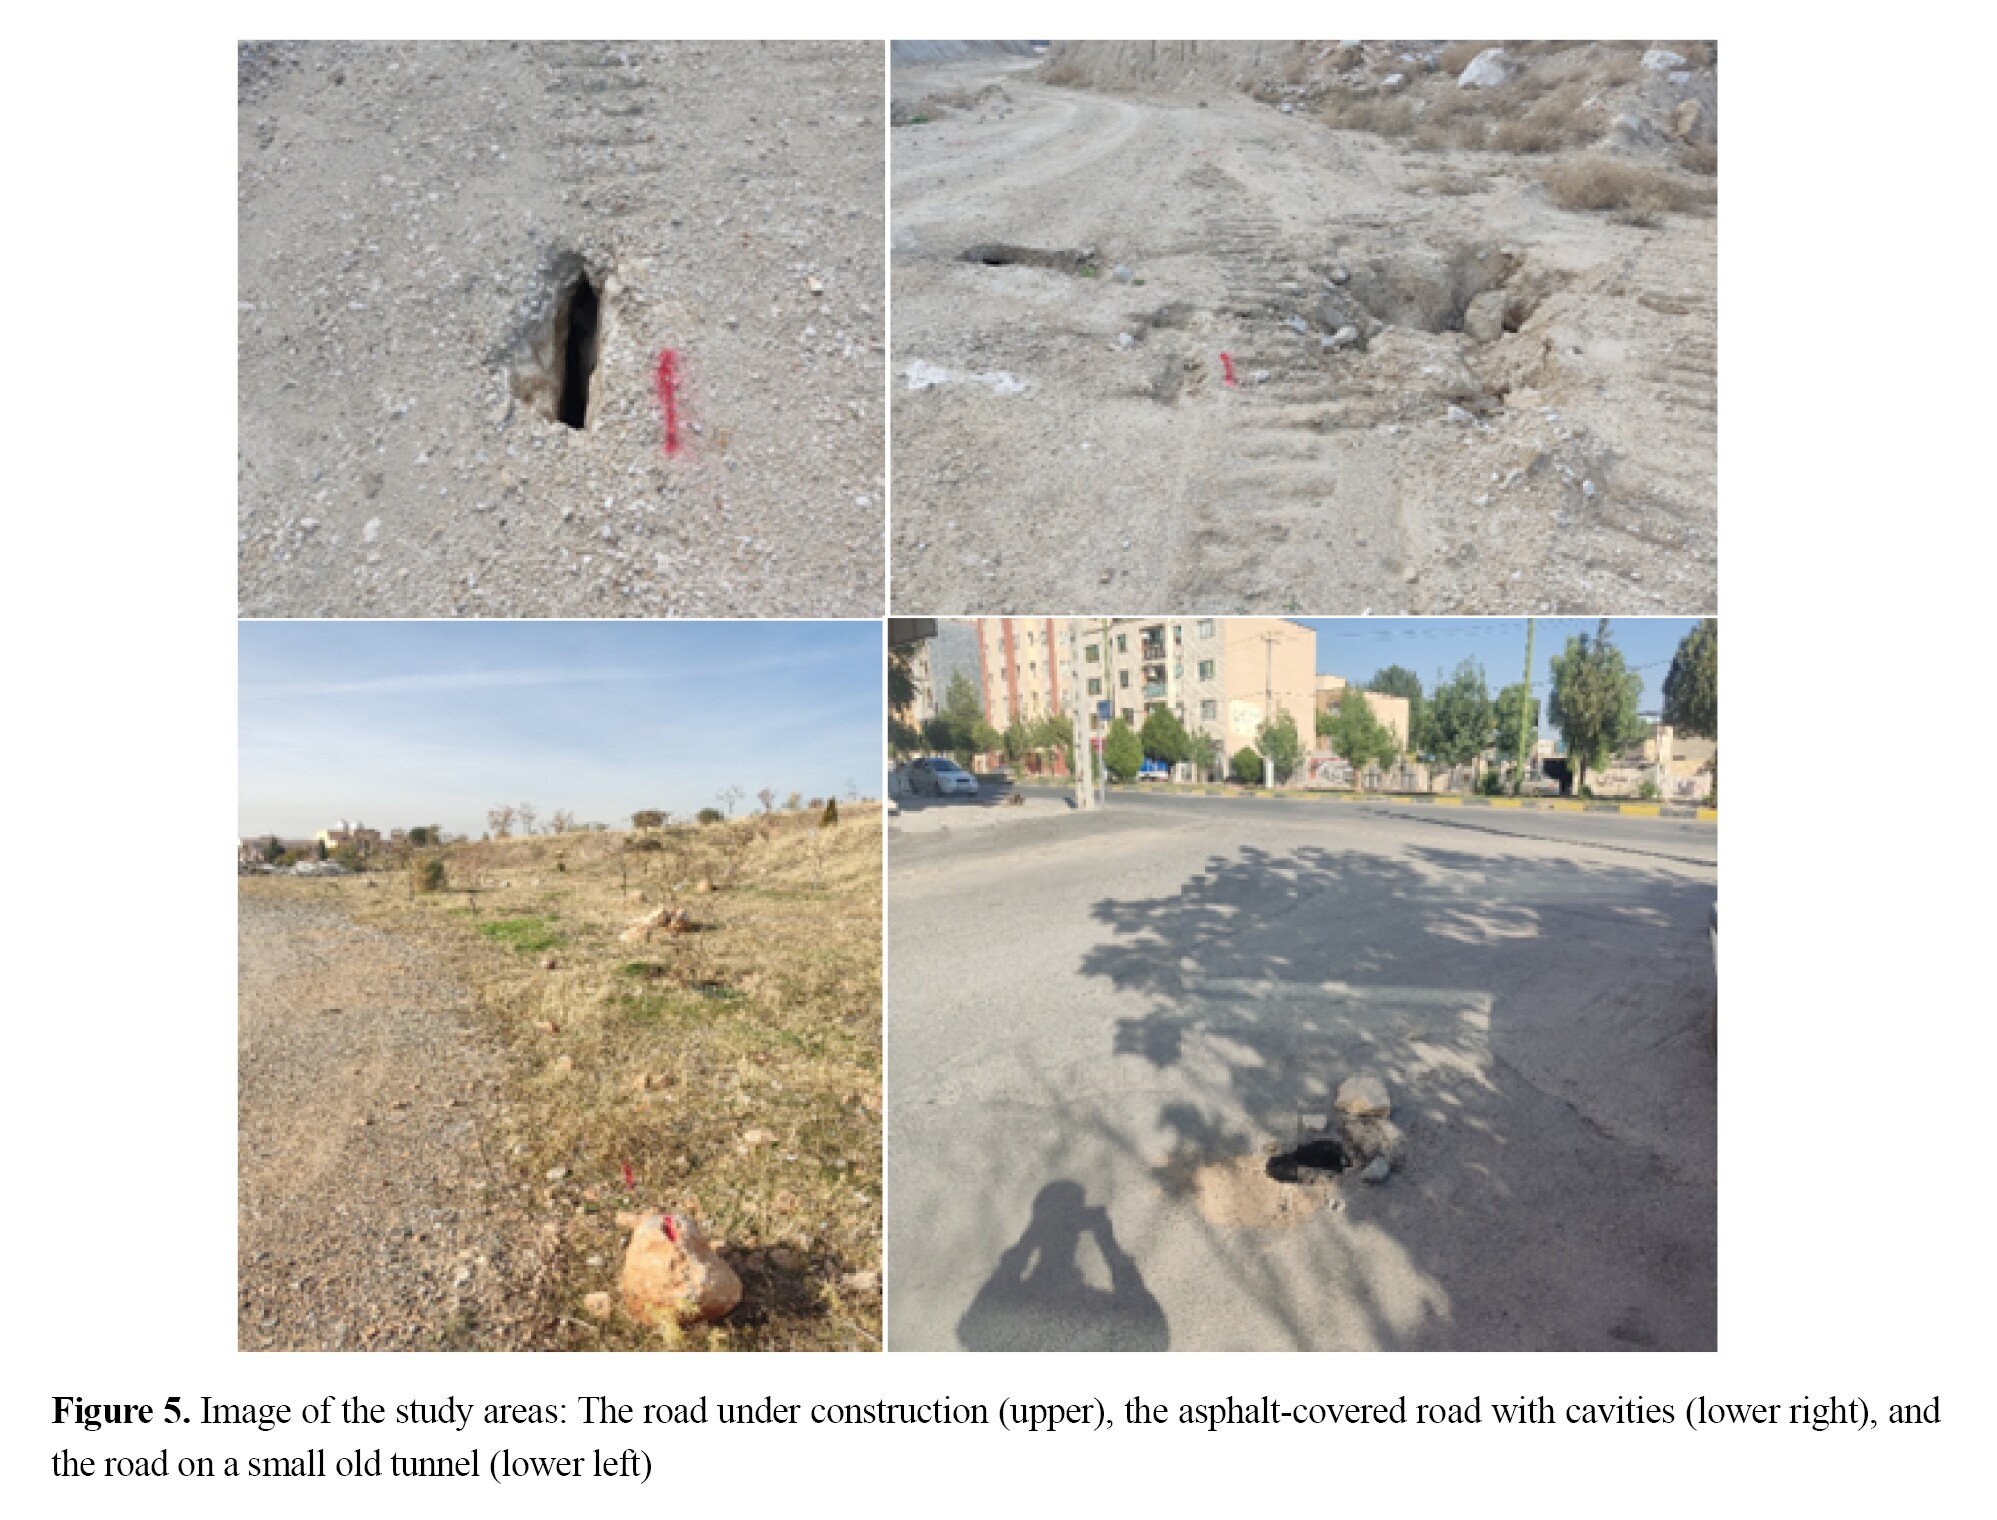
Data collection was carried out in three areas, including a road under construction (first area), an asphalt-covered street and road (second area), and the road on a small old tunnel (third area). Figure 4 shows a satellite image of the selected areas as well as a view of the profiles taken in these areas. These areas were selected in such a way that the cavities and fractures in them were visible or obvious. Geologically, these areas contain Holocene sediments. Two areas were in Ilam Province and one area on the outskirts of Kermanshah City, all of which were located in the Zagros geological zone. The road under construction was in the Gachsaran Formation. One of the characteristics of this Formation is its high susceptibility to erosion, especially erosion caused by water.
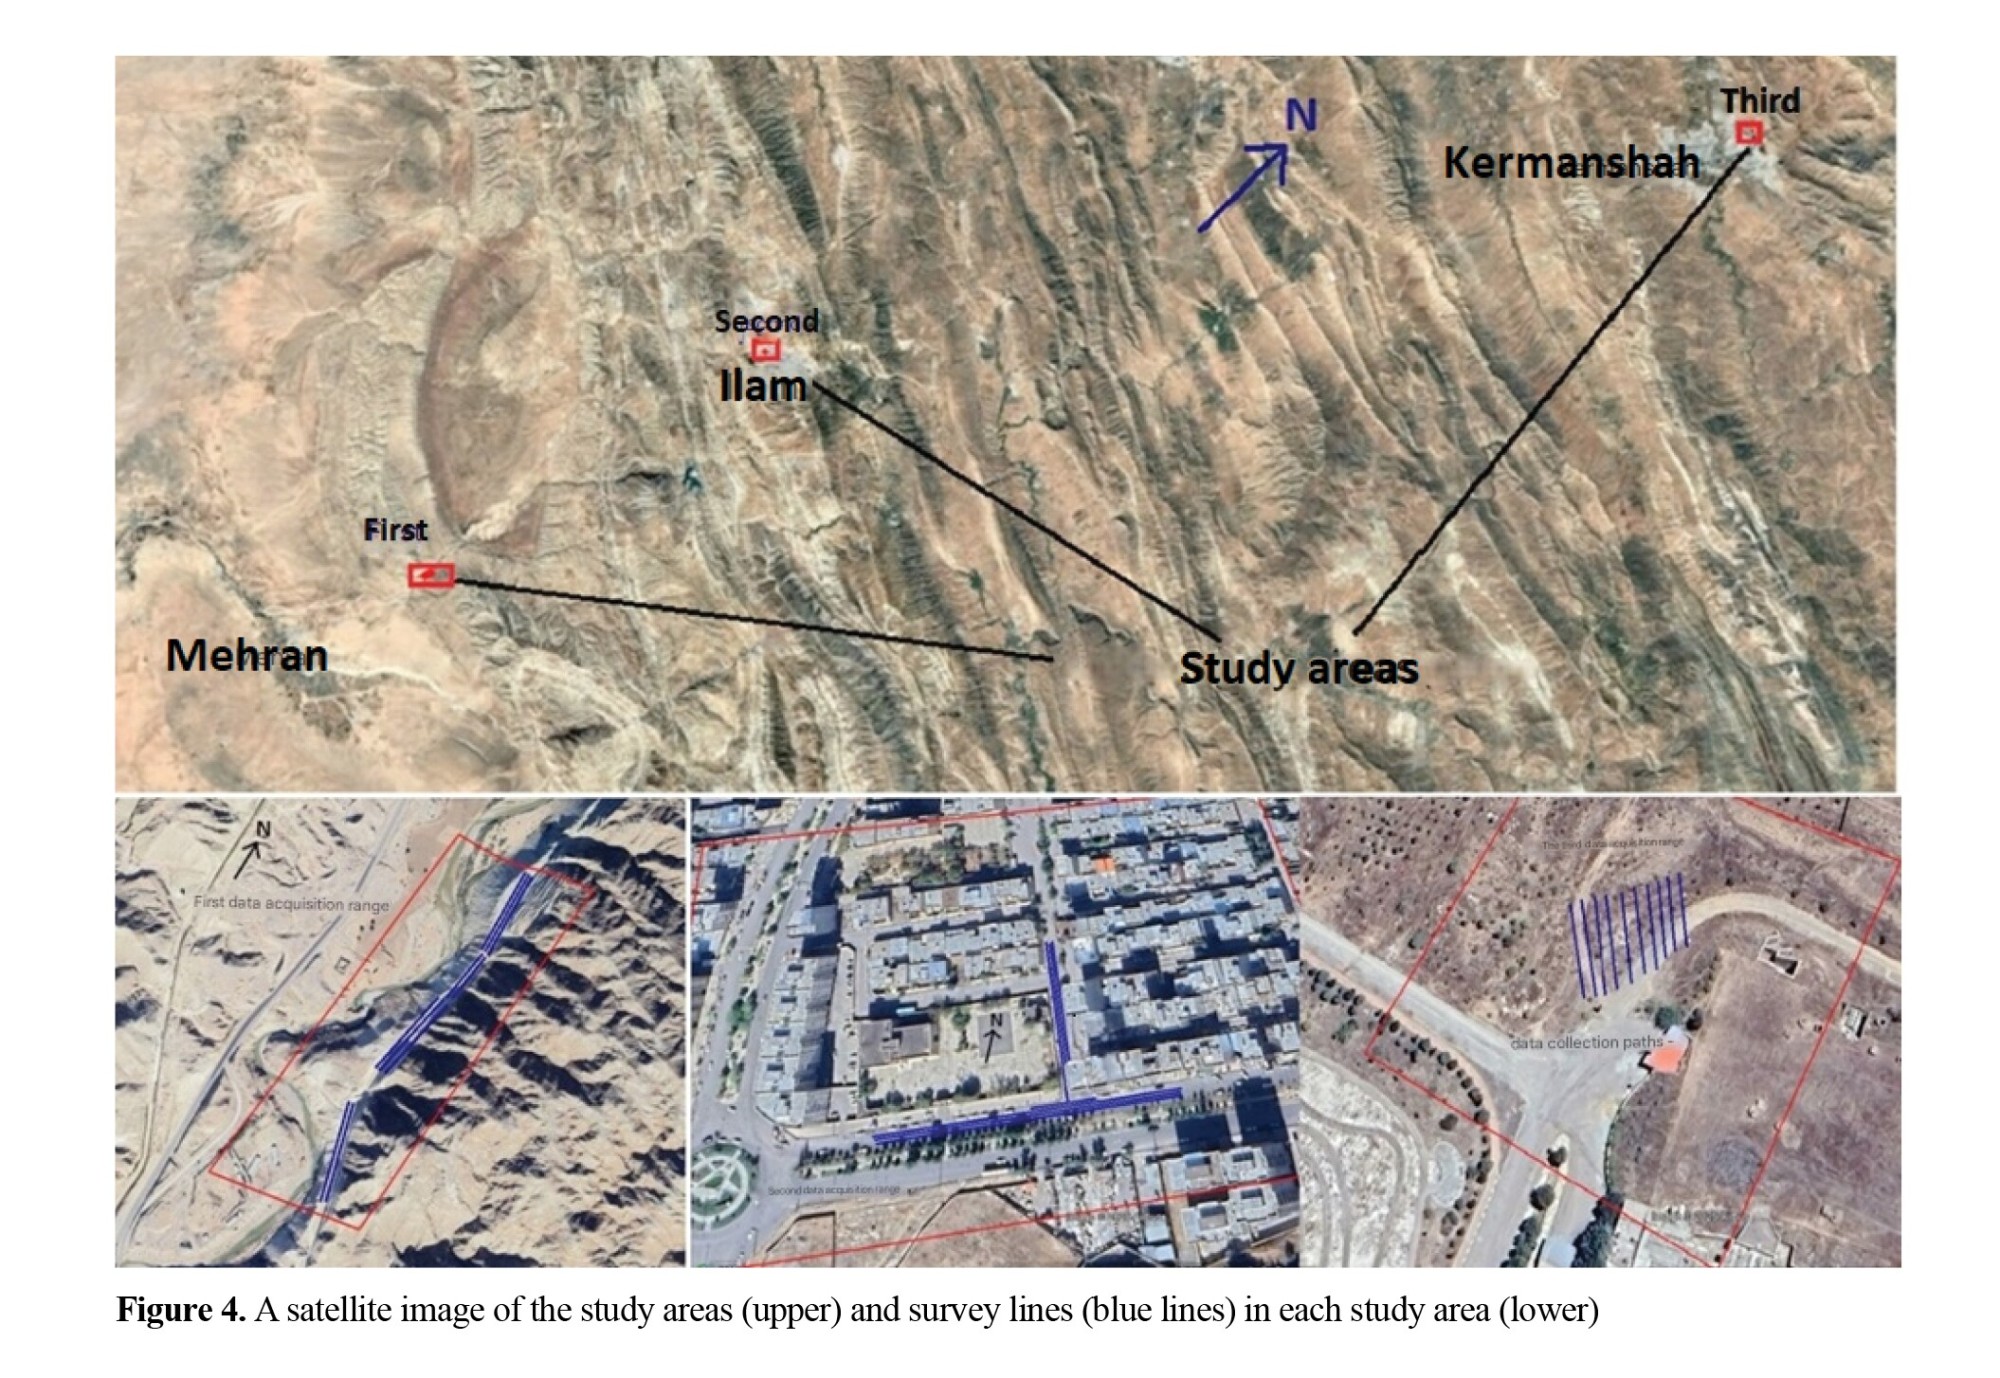
This formation consists of more than 500 meters of alternating red to blue-gray gypsum and marl, interbedded with cream-colored marly limestone. In fact, the dissolution rate of these materials is much higher than other rocks. Accordingly, karsts, cavities, frequent fractures, foliation, and spongy conditions in areas close to the surface are observed in this formation. Figure 5 shows the study area and the cavities and fractures on the surfaces.
 Data processing
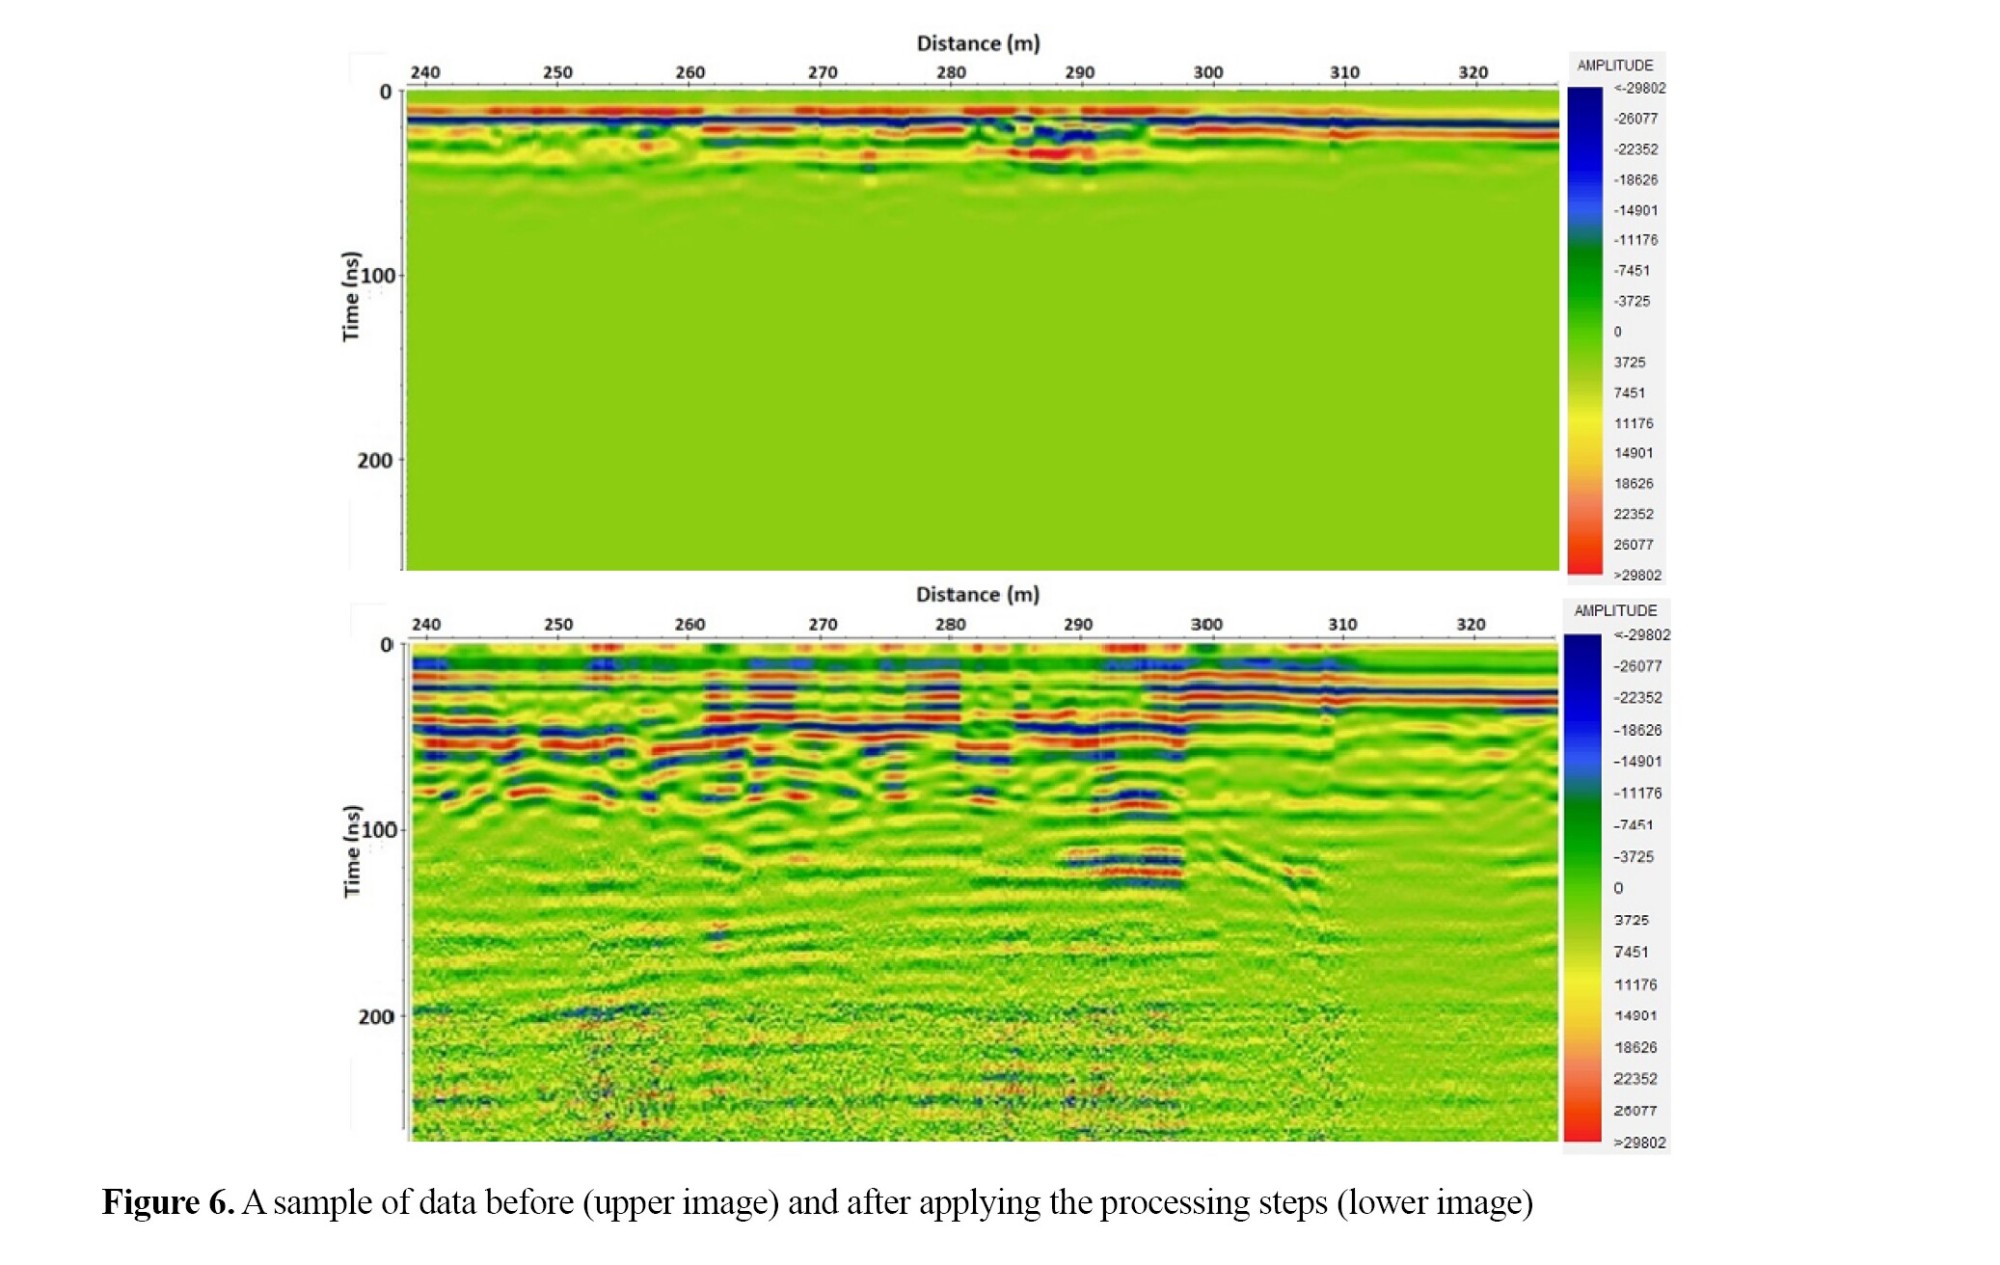
In this study, data acquisition was performed with two antennas with center frequencies of 170 and 600 MHz and a horizontal sampling distance of 4 cm. Reflexw and CrossPoint were used to process the data. The data processing steps included automatic gain control (AGC), bandpass filtering, Dewow filtering, static correction, subtract-DC-shift, and background removal. It should be noted that after data processing, only the results of the identified anomalies are presented. The values of the parameters used in different stages of data processing are presented in Table 1.
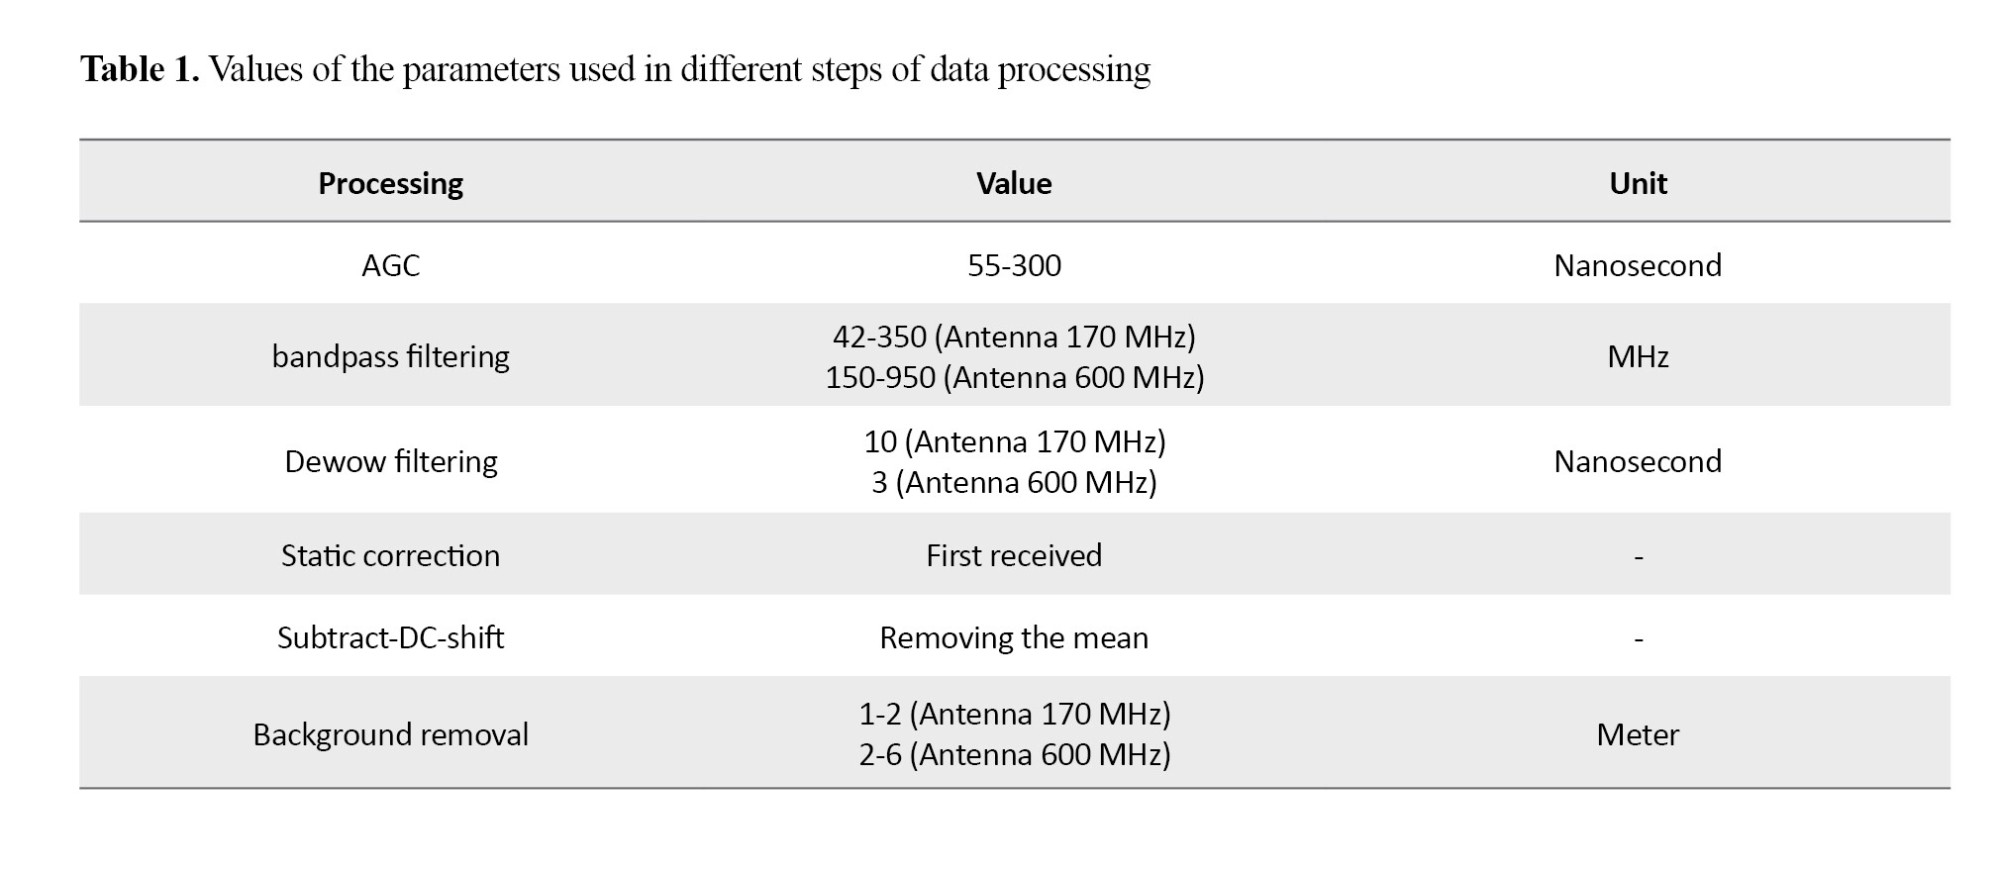
Figure 6 shows an example of the data obtained before and after processing.
 Data analysis
After data processing, velocity analysis and wave spectrum analysis were performed, taking into account the characteristics of subsurface cavities and fractures in the GPR data, as well as examining the reflection coefficient and phase of the waves returning from the anomalies observed in the data, and the results were interpreted.
Results
Figure 7 shows the results of the processed data for the first study area using both the 600 and 170 MHz antennas. In this figure, the location of the cavities and fractures is depicted. The results indicate the presence of many cavities with different dimensions from one meter to several meters, which are located along the fractures (crushed area) and in combination with them. Due to the large number of small cavities in this area, only large cavities and fractures are shown in Figure 7. The area with these discontinuities is also shown well and with high resolution. The results obtained using the 600 MHz antenna show more detail in the near-surface region and confirm the extension of the region to the ground surface.
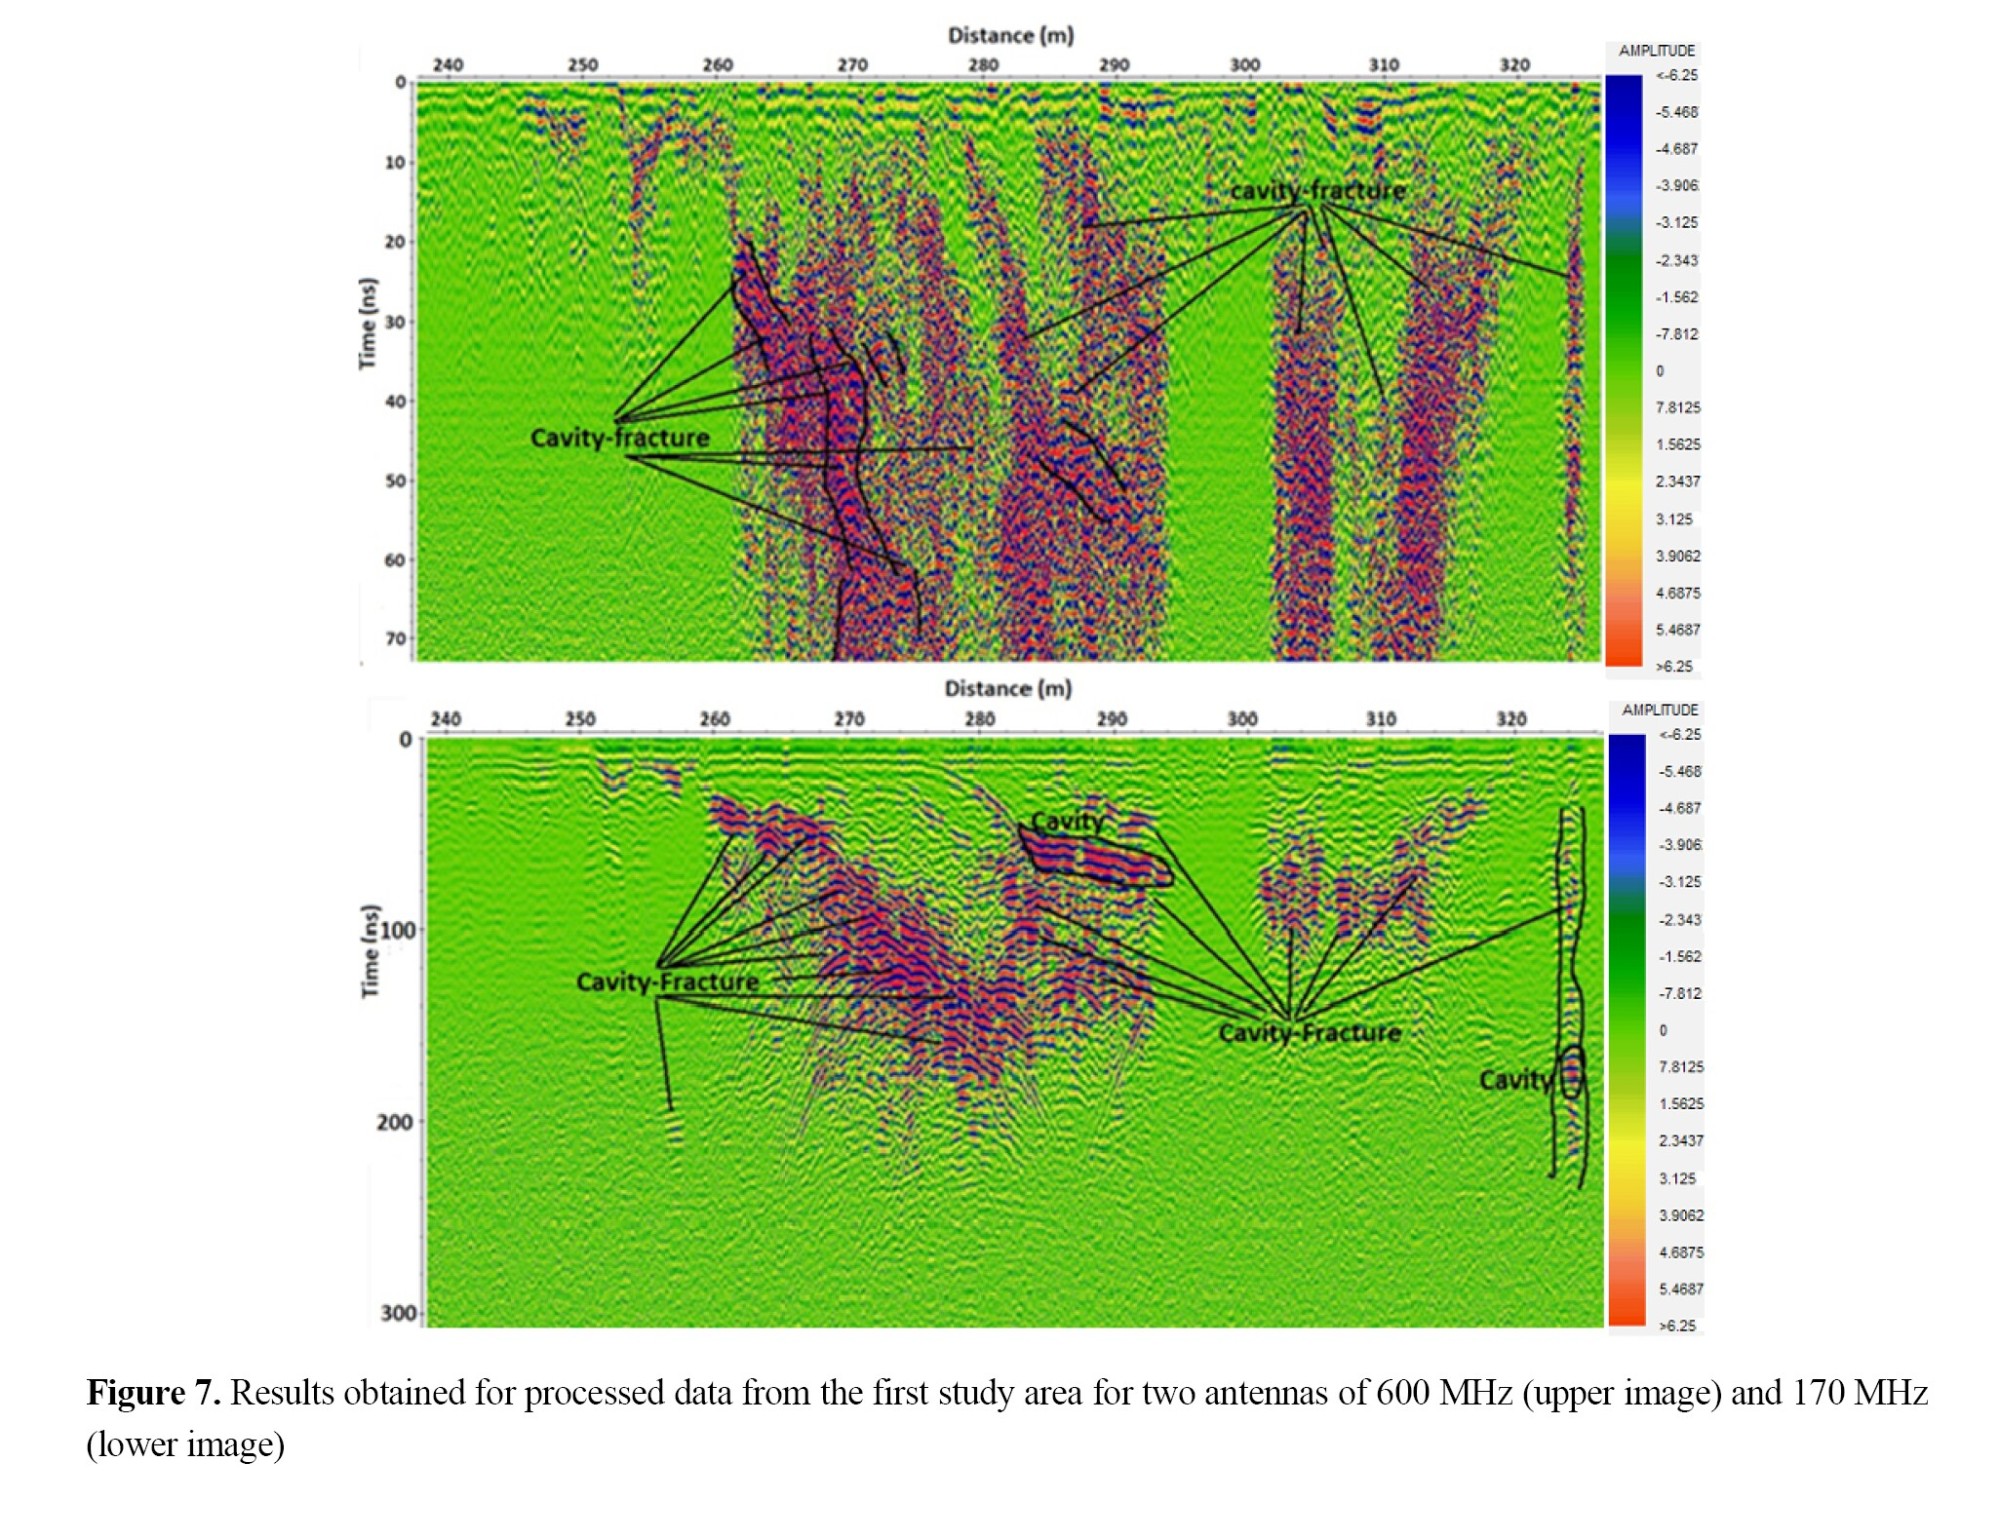
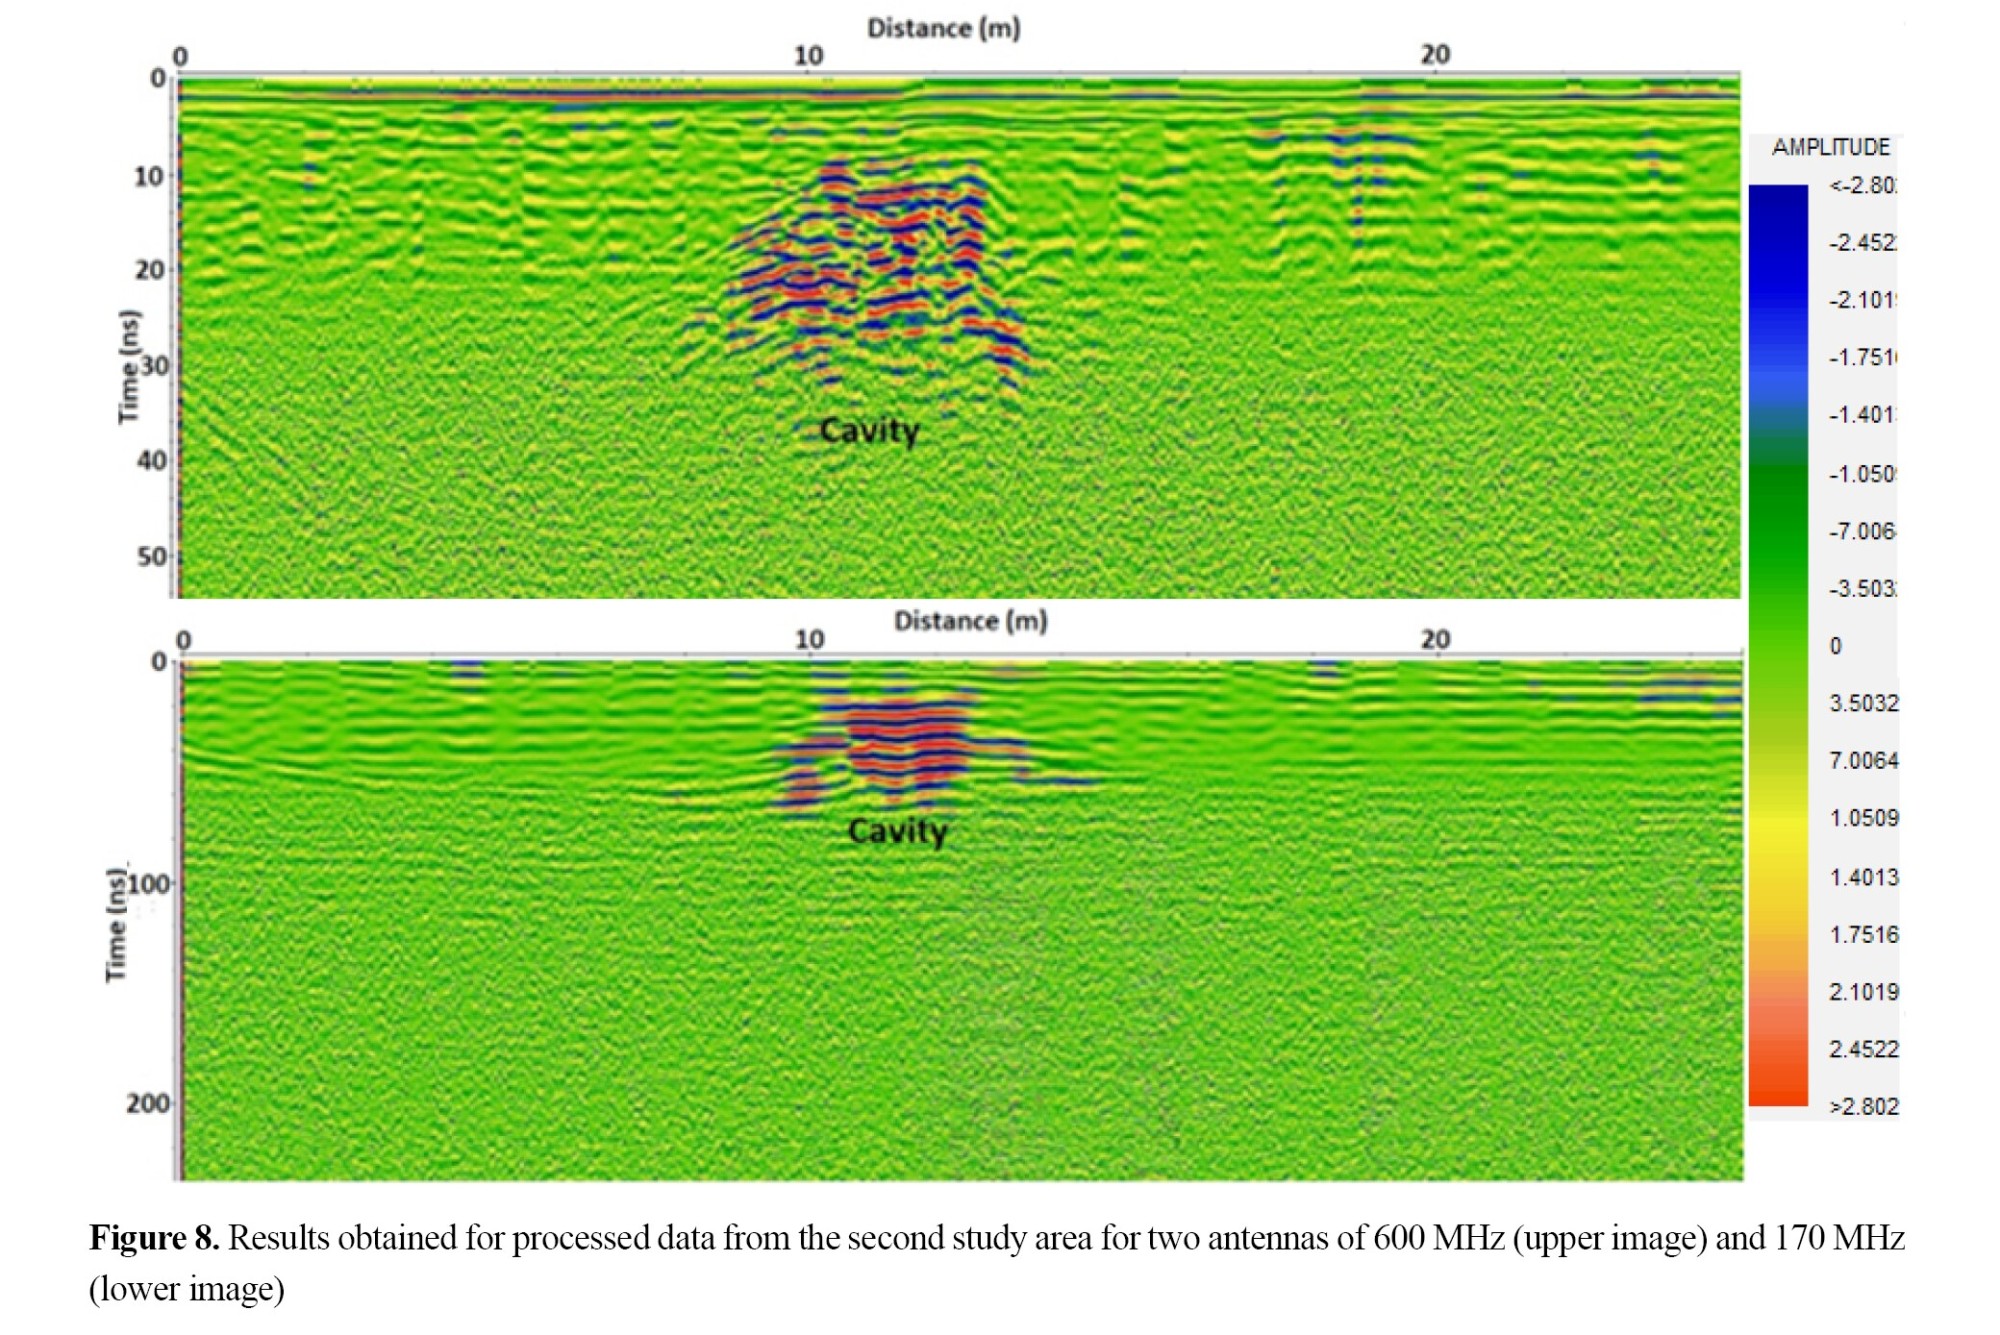
Figure 8 shows the results after data processing for the second area, which was an asphalt-paved street with subsurface cavities. By using both the 600 and 170 MHz antennas, the presence of a cavity in the area was evident. It should be noted that the data in this area were collected in different parallel lines with a distance of one meter from each other, and the best profile for detecting the cavities was selected and presented. The void identified in these data is close to the surface and is in complete agreement with field observations. The cavities along the profile line were about 3 meters in length and about 1 meter in height.
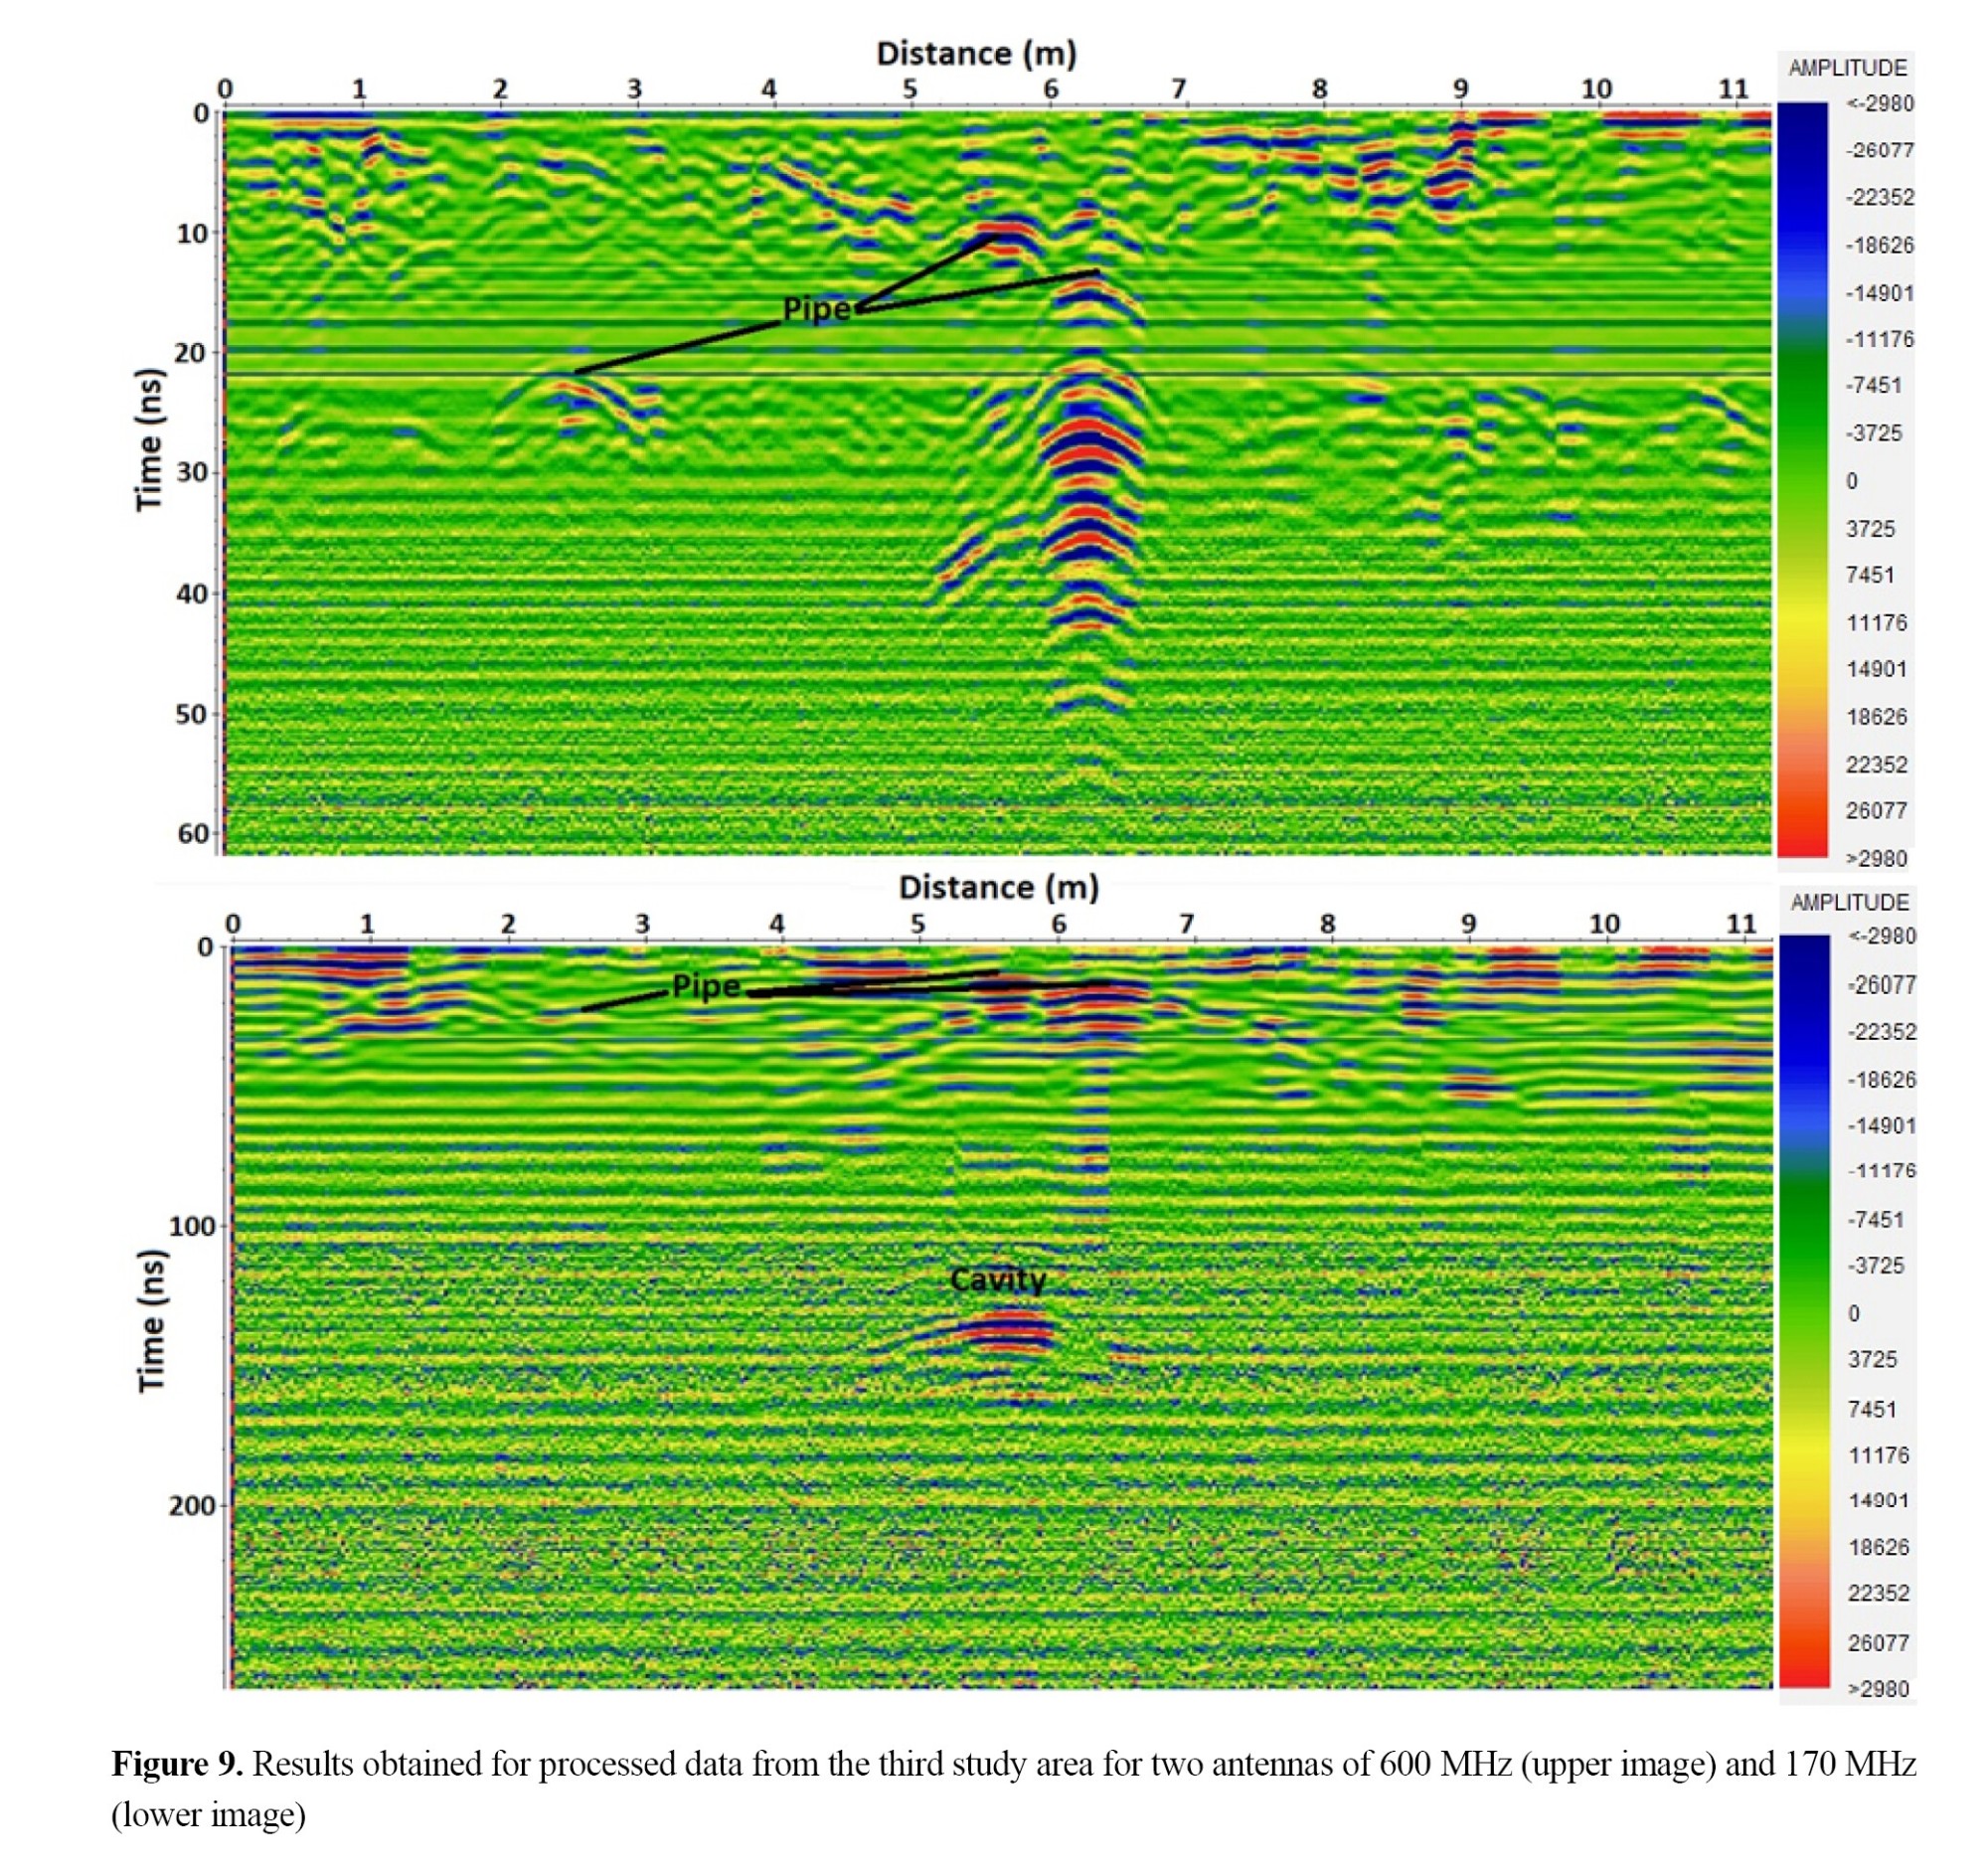
For the third study area, where a small old buried tunnel is located, the results are shown in Figure 9 using both the 600- and 170-MHz antennas. In this survey, after finding the area and route of the tunnel, 15 profile lines were surveyed perpendicular to the possible road, with a distance of 3 meters from each other. In most of the results obtained for these profiles, the location of the tunnel was clearly visible. However, in two of these profiles, the anomaly related to the tunnel was lower, which could indicate local filling of the tunnel. Given that the tunnel was relatively deep (6-7 m depths), its presence was visible using the 170-MHz antenna. It should be noted that there were also underground facilities in this area, including several pipes, the image of which is well defined in the results using the 600-MHz antenna. Considering the profile passing in a direction almost perpendicular to the identified route for the tunnel, the tunnel cavity was about 80 centimeters in width and about 1 meter in height.
 Conclusion
In this research, using a GPR device with two antennas with central frequencies of 170 and 600 MHz, subsurface studies of three areas with evidence of cavities and fractures were conducted. The first study area was in the Gachsaran Formation; it was a road under construction in Ilam Province. The second area was an asphalt-paved street in Ilam Province. The third study area was in Kermanshah City; the area was a road on a small, old tunnel that was buried decades ago. All three areas had different dimensions, depths of placement, and geological conditions of the cavities, allowing the efficiency of the GPR method to be evaluated using 600- and 170-MHz antennas. Both antennas were used to collect data at their best penetration depth; for near the surface (<3-m depth) the 600-MHz antenna was used, while for greater depth (<14 meters) the 170-MHz antenna was used. The results from all three areas, after data processing and analysis, confirmed the presence of cavities and fractures at varying depths and dimensions. Overall, the results revealed the high capability of the GPR method to identify cavities and fractures, and, consequently, the presence of areas prone to collapse.
Ethical Considerations
Compliance with ethical guidelines
There were no ethical considerations to be considered in this research.
Funding
A part of the data collection in this study was carried out with financial support from the General Directorate of Roads and Urban Development of Ilam Province.
Authors' contributions
All authors contributed equally to the conception and design of the study, data collection and analysis, interpretation of the results, and drafting of the manuscript. Each author approved the final version of the manuscript for submission.
Conflicts of interest
The authors declared no conflict of interest.
Acknowledgments
The authors would like to acknowledge Tehran Disaster Mitigation and Management Organization (TDMMO) and Razi University, Kermanshah, Iran, for their help in providing research documents and methodological aspects of the job.
References
Ahmadi, R., Fathianpour, N., & Norouzi, G. (2014). [Improving Ground Penetrating Radar (GPR) forward modeling approach using the numerical finite difference method (Persian)]. Iranian Journal of Geophysics, 8(3), e33558. [Link]
Annán, A. P. (2009). Electromagnetic principles of ground penetrating radar. In H. M. Jol (Ed.), Ground Penetrating Radar: Theory and Applications (pp. 1-40). Amsterdam: Elsevier. [DOI:10.1016/B978-0-444-53348-7.00001-6]
Benedetto, A., Tosti, F., Ciampoli, L. B., & D’amico, F. (2017). An overview of ground-penetrating radar signal processing techniques for road inspections. Signal Processing, 132, 201-209. [DOI:10.1016/j.sigpro.2016.05.016]
Daniels, D. J. (2004). Ground Penetrating Radar. London: The Institution of Electrical. [DOI:10.1049/PBRA015E]
Hosaini, M., Kamkar Rouhani, A., Mohammadivizheh, M., & Parnow, S. (2017). [A comparison between the results of ground penetrating radar and magnetic surveys in near surface investigations: A case study (Persian)]. Iranian Journal of Geophysics, 11(2), 76-86. [Link]
Goodman, D., & Piro, S. (2013). GPR remote sensing in archaeology. New York: Springer. [DOI:10.1007/978-3-642-31857-3]
Neal, A. (2004). Ground penetrating radar and its use in sedimentology: principles, problems and progress. Earth Science Reviews, 66, 261-330. [DOI:10.1016/j.earscirev.2004.01.004]
Parasnis, D. S. (1997). Principles of applied geophysics. London: Chapman and Hall. [Link]
Slob, E., Sato, M., & Olhoeft, G. (2010). Surface and borehole ground-penetrating-radar developments. Geophysics, 75(5), 75A103-75A120. [DOI:10.1190/1.3480619]